Submitted by admin on February 15, 2024 - 10:15am
Submitted by admin on March 29, 2022 - 7:42am
Submitted by admin on June 30, 2013 - 11:33am
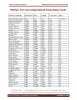
In addition to Biological Value (BV) this chart provides an analysis of fat percentage and the number of grams of protein, fats and carbs identified in 100 gram portions of common natural foods derived from both plant and animal sources.
Submitted by admin on November 26, 2011 - 3:36pm

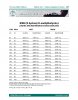
A guide to individual dose loading and daily L-Glutamine consumption based on lean mass and gender.
Submitted by admin on November 26, 2011 - 3:33pm
A guide to individual dose loading and daily HMB consumption based on lean mass and gender.
Submitted by admin on November 26, 2011 - 11:12am
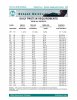
A guide to individual dose loading and daily creatine consumption based on lean mass and gender.
Submitted by admin on November 26, 2011 - 10:52am
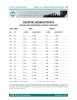
A guide to individual daily protein consumption based on four classes including class one (inactive/sedentary), class two (aerobic/endurance), class three (aerobic/anaerobic/speed) and class four (anaerobic/size/strength)
Submitted by admin on November 26, 2011 - 10:37am
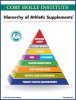
Provides a guideline for the use of dietary supplements beginning with the primary essential micronutrients up to medicinal agents
Submitted by admin on November 26, 2011 - 10:32am
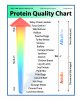
Provides a range of protein sources from high (whey protein isolate) to low (luncheon meats) quality including pH and denatured state
Submitted by admin on November 26, 2011 - 10:27am
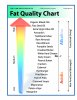
Provides a range of fat sources from high (organic mixed oils) to low (margarine) quality including pH and micronutrients density
Pages
